Adsorption and desorption processes occur everywhere. They play an important role in areas such as surface science, biomaterials, cell and molecular biology, and pharmaceutical development and production, where molecules and nanoparticles interact with various surfaces in different contexts.
Adsorption can be defined as the ‘adhesion’ of molecules from a liquid or gas phase onto a surface. Desorption is the reverse phenomenon, when adsorbed molecules are removed from a surface. QCM-D technology, which is essentially a balance for small masses, can monitor molecular adsorption and desorption processes in real-time by detecting the mass changes following the molecular uptake or release from the surface studied.
Depending on the application and objective of the study, it may be relevant to either understand, characterize or optimize the adsorption or desorption events. Either way, it will be relevant to monitor the amount of material that is being added to or leaving the surface, and it may also be relevant to investigate the rate at which the process occurs. Each time material is added to or removed from a surface, there is a corresponding change in mass, which will be detected by QCM-D in real-time.
As an example, let’s have a look at protein adsorption on two different surfaces, one glass surface and one plastic. As outlined in Figure 1, we follow the steps below.
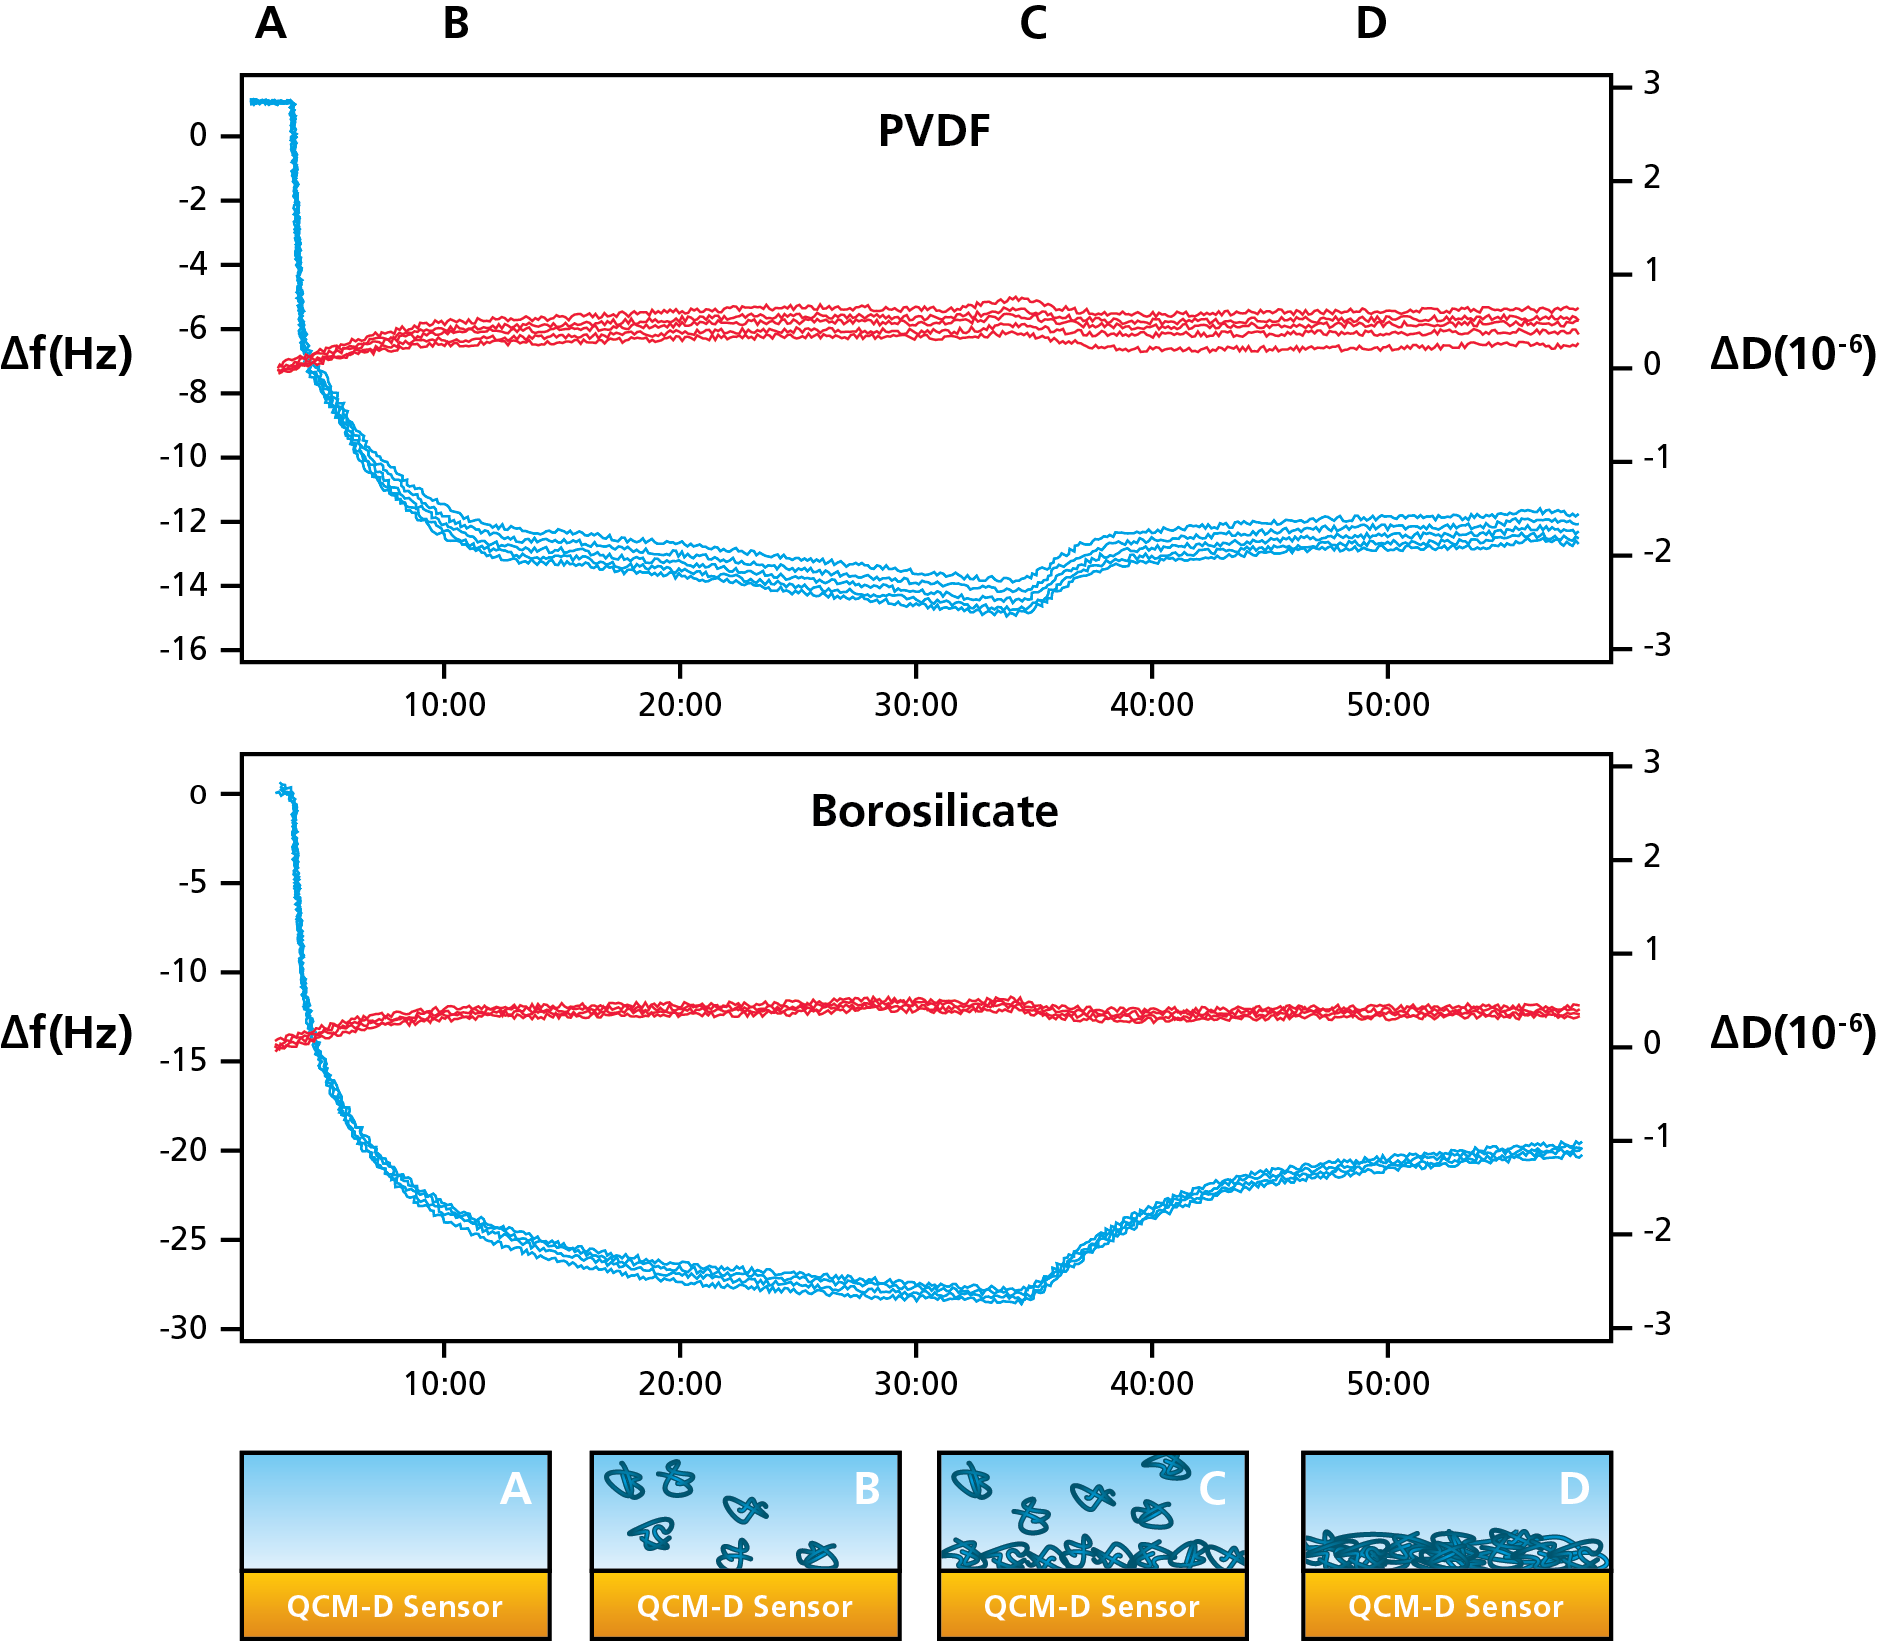
Figure 1. (Top) Protein adsorption on plastic (PVDF) and glass (borosilicate) measured with QCM-D. (Bottom) Schematic illustration of the protein adsorption process.
Monitoring the mass as a function of time, evaluating surface interaction processes is straightforward. It is also possible to compare behavior under different conditions by varying for example the concentration, temperature, pH and ionic strength.
In addition to the example shown here, other types of adsorption and desorption events that could be characterized by measuring the mass uptake and mass loss include, for example, surface interaction of surfactants, polymers and nanoparticles.
Download the overview to read more about what information you can obtain with QSense QCM-D.

Malin graduated in engineering physics in 2006, where her research focused on the QCM-D technology. Since then, she has been scrutinizing the how’s and why’s of the world in general, and the world of QCM-D in particular.