QCM-D technology has been used for the analysis of lipid bilayer formation since 19981. Here we describe what makes QCM-D particularly suitable for this kind of analysis and show what a typical measurement can look like.
QCM-D technology measures two parameters, f and D, and provides time-resolved information on mass, thickness and viscoelastic properties of layers at the sensor surface. This means that the interaction dynamics between lipid structures and the sensor surface can be monitored as they take place, and the layers formed can be characterized. This combination makes the technology particularly suitable for detecting and revealing the transition from surface-adhering vesicles to a surface supported bilayer.

There are different ways to form surface supported lipid bilayers, for example via the vesicle rupture and fusion method1-4 and via the solvent-assisted lipid bilayer (SALB) formation method5. The ambient conditions have a great impact on the bilayer formation dynamic and success2, and QCM-D can reveal what impact the various conditions have as well as whether a bilayer was successfully formed or not.
Let’s have a look at a schematic example where the supported lipid bilayer formation via the rupture and fusion method is studied with QCM-D technology.
As already mentioned, supported lipid bilayers can be formed in different ways. One approach is via spontaneous adsorption and rupture of phospholipid vesicles1-4. Thanks to QCM-D sensing hydrated mass, the structural rearrangement from vesicles to a supported lipid bilayer results in unique fingerprints which are straightforward to detect with QCM-D.
For example, using zwitterionic vesicles on silica, there is a distinctive two-step behavior revealing the adsorption of intact vesicles at the surface, which then, at a critical surface coverage, rupture and fuse to form a bilayer, (Figure 1).
The final shifts of f and D are characteristic and will reveal the quality of the layer formed and if there for examples still are intact vesicles present.
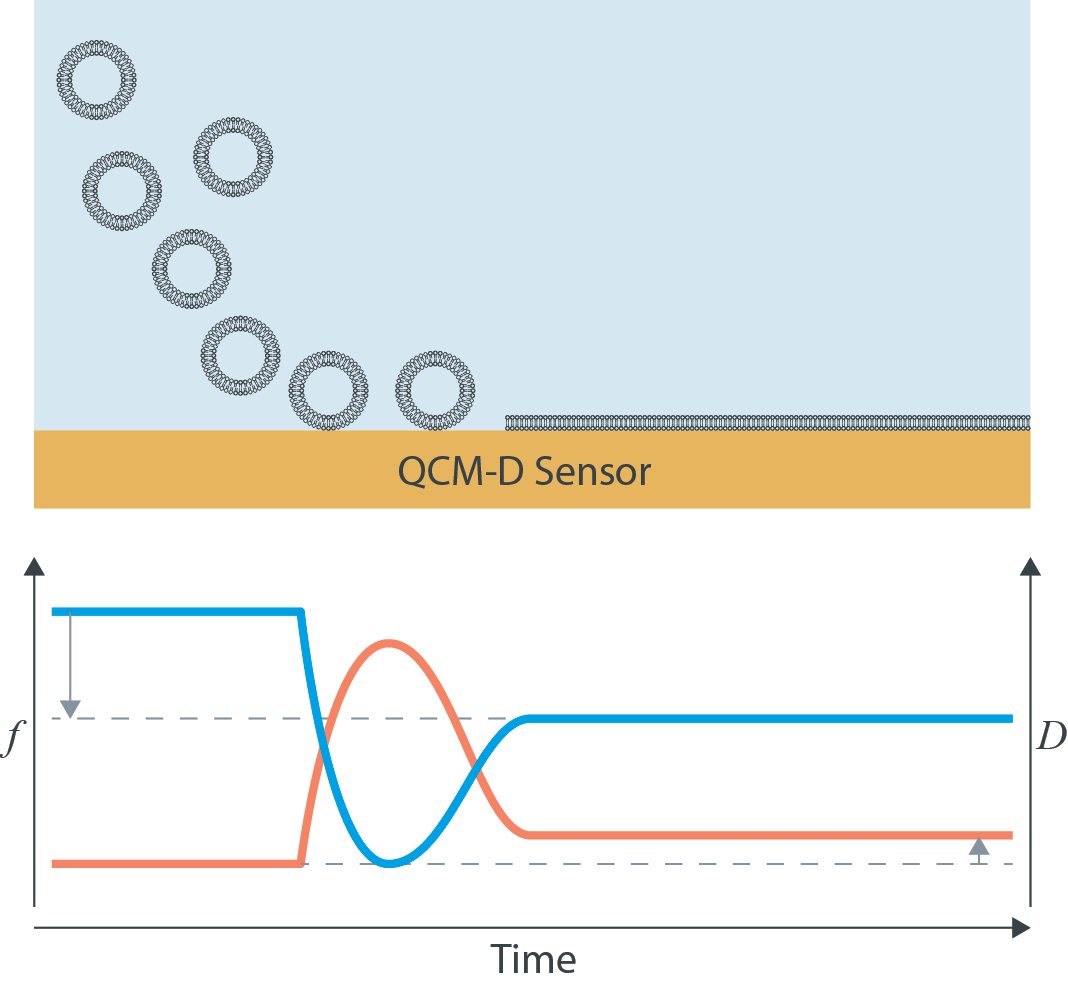
Figure 1 Schematic illustration of bilayer formation (not to scale). Top: Formation of a supported lipid bilayer monitored by QCM-D. Starting from stable baselines in buffer vesicles are introduced. The measured f and D show the unique fingerprint of vesicle rupture and fusion. First, there is an initial large uptake (decrease in f and increase in D) indicating vesicle adsorption at the surface. Next, both the f and D curves turn, indicating that mass is lost and the layer at the surface is becoming less soft. Finally, the curves equilibrate at characteristic f and D values, where the frequency is twice that of a lipid monolayer and the dissipation is low, indicating a thin and rigid layer.
In cases where the supported lipid bilayer is used as a model membrane platform for subsequent layer build-up, it can be relevant to verify the bilayer formation process and evaluate the quality of the formed bilayer. Other situations where it can be relevant to explore the bilayer formation process is, for example, if vesicles of more complex lipid mixtures are used, or if the ambient conditions are changed.
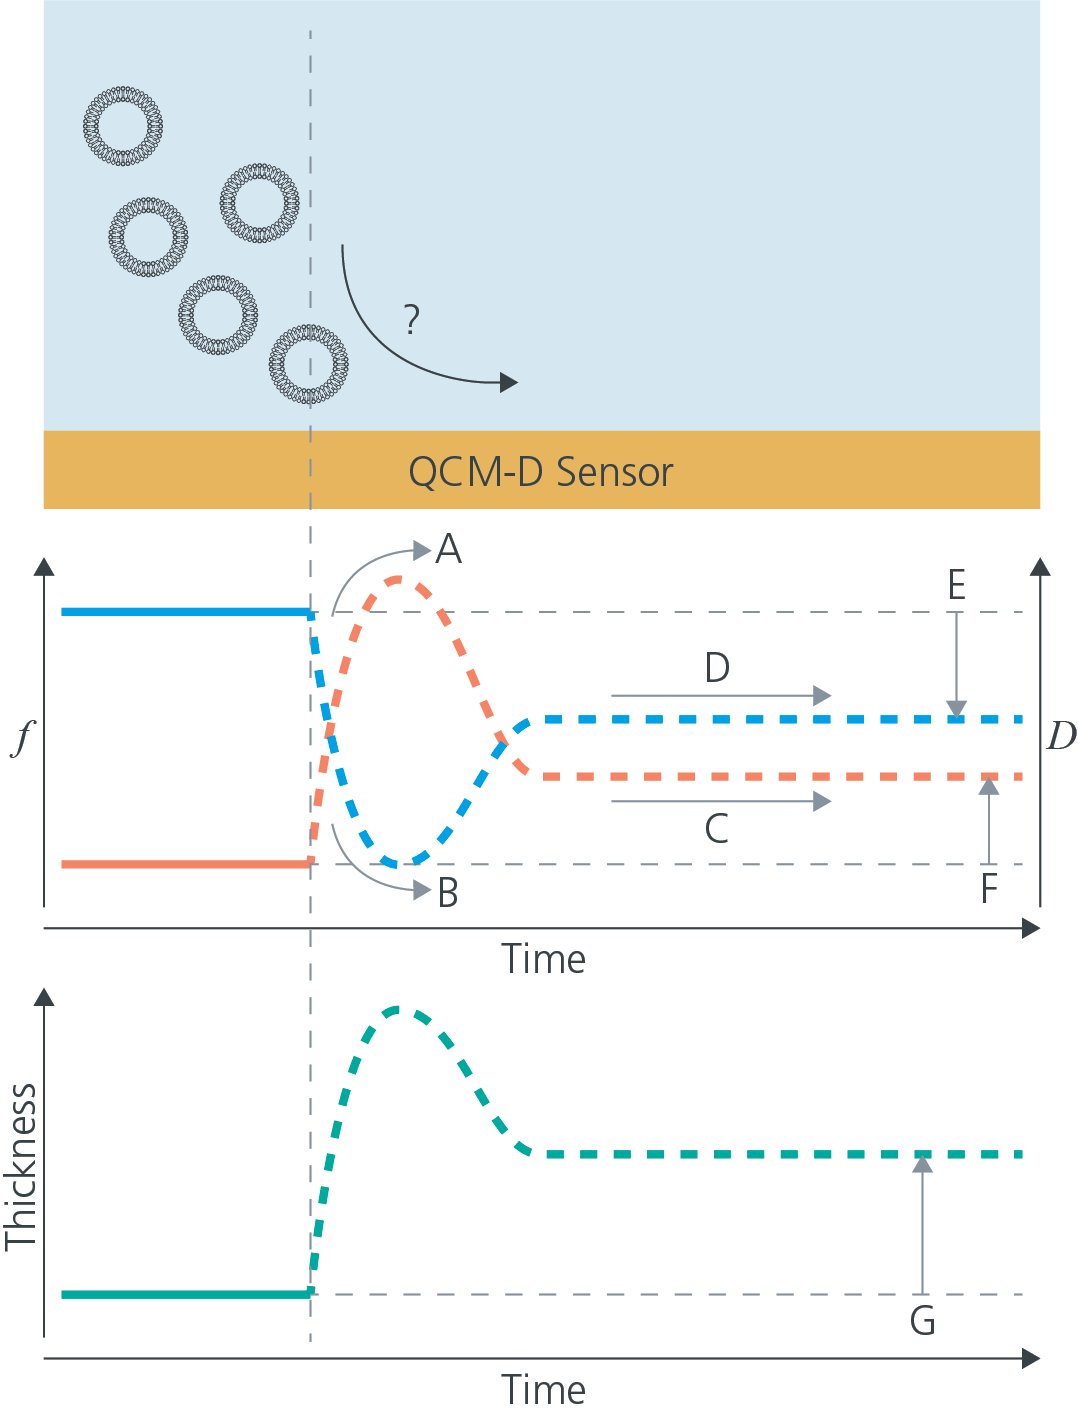
Figure 2: Using QCM-D, questions related to the bilayer formation dynamics can be answered and the layer can be characterized. For example, are the vesicles rupturing (A, B)? What is the lipid bilayer formation dynamics (A-D)? What is the quality (E, F) and thickness of the supported lipid bilayer (G)?
Download the overview to read more about how QCM-D is used in the analysis and characterization of supported membrane platforms and other lipid model systems.

Malin graduated in engineering physics in 2006, where her research focused on the QCM-D technology. Since then, she has been scrutinizing the how’s and why’s of the world in general, and the world of QCM-D in particular.