At a first glance, SPR and QCM-D are quite similar. Both are used in surface interaction analysis to monitor specific interactions, molecular binding, and adsorption events. The two technologies indeed show many similarities, but there are also differences that are significant when it comes to experimental capabilities and information extraction. Here we sort out the key differences and list examples of when to use which method.
Comparing two instruments of the respective technology, you will see a set of differences. Some of which are inherent in the measurement principle, and some which originate in the hardware design. Prior to deciding which method to use, you must, therefore, define which information output that you are looking for and what the needed experimental capabilities to run the experiments are. Is the technology able to deliver the answers that you are looking for, and is the supplier of the technology offering all the possible features that you need to run the experiments?
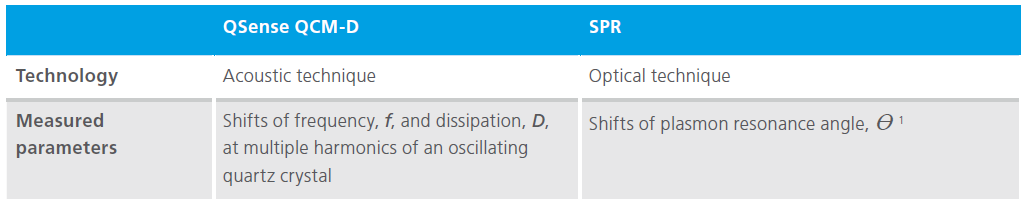
Starting with the respective technology and measurement principle, QCM (including the extended versions, QCM-D, QCM-I, QCM-A, etc) is an acoustic technology and SPR an optical one, Table 1. In brief, and without going into detail how the respective technology works, QCM measures resonance frequency changes, f, of an oscillating quartz crystal, while SPR measures changes of the surface plasmon resonance angle, ϴ. The resonance frequency of the crystal oscillation is sensitive to mass changes, and the SPR angle is sensitive to refractive index changes. In addition to f and ϴ, additional parameters may be captured by the respective technology, which then expands the amount of information that the technology can extract.
Depending on which, and how many, captured parameters that are offered by the specific QCM supplier, information output from QCM technology ranges from mere qualitative information about time-resolved mass changes at the surface to quantitative information about mass, thickness and viscoelastic properties at high time resolution. Information output offered by a standard SPR instrument ranges from relative information about refractive index changes at/ near the surface, to quantitative information about the refractive index, thickness, density and surface coverage.
Download the overview to read more about the key differences between QCM-D and SPR, and to get examples of when to use which technology.

Malin graduated in engineering physics in 2006, where her research focused on the QCM-D technology. Since then, she has been scrutinizing the how’s and why’s of the world in general, and the world of QCM-D in particular.