Quartz Crystal Microbalance with Dissipation monitoring, or QCM-D for short, is a surface sensitive, label-free technology that measures mass changes at the surface with nanoscale resolution, as well as the viscoelastic properties of the surface-adhering layer. The time-resolved information is typically used to analyze molecule-surface interaction, such as adsorption, desorption, and binding, as well as layer structure.
QCM-D is an extended version of QCM, Quartz Crystal Microbalance. The fundamental working principle of QCM-D is the same as for QCM – a piezoelectric sensor is excited to resonance by the application of an alternating voltage, and the resonance frequency, f, is monitored as a function of time. The resonance frequency of the sensor depends on its mass (thickness). Frequency changes, Δf, will therefore reveal changes of the mass coupled to the sensor surface, and can be used to detect and analyze molecule-surface interactions, such as molecule adsorption and desorption, which will show as mass uptake and mass loss, respectively, Fig. 1.
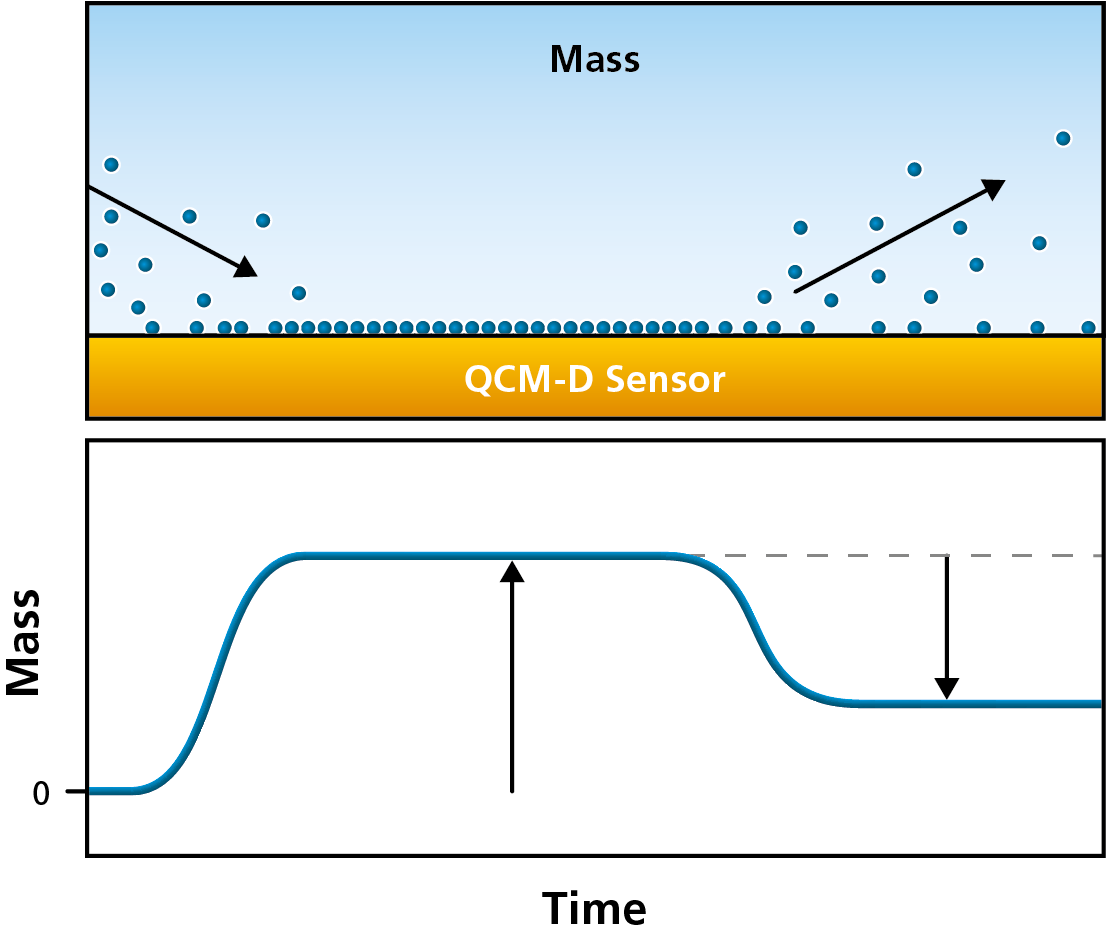
Figure 1. A schematic illustration of mass uptake and mass loss, as molecules adsorb to, and desorb from, the QCM-D sensor surface.
In addition to measuring Δf, QCM-D also measures the energy loss, the dissipation, ΔD, of the system under study. The D-value reflects the mechanical properties of the surface-adhering layer and can, in combination with Δf, be used to quantify mass, thickness and viscoelastic properties of soft layers, something which is not possible looking at the Δf response alone. The combined information of Δf and ΔD that QCM-D offers makes it particularly suitable for analysis and characterization of hydrated systems which are often viscoelastic.
QCM:s sense the hydrated mass, i.e. mass including both the molecules at the sensor surface and coupled solvent. This feature makes QCM-D an excellent tool to analyze layer structure, and to detect structural changes, of the molecular layer, such as for example swelling and collapse. In a scenario where there is a structural change within the layer, the molecular mass will be the same throughout the rearrangement process, but the mass of the associated solvent will vary. For example, if a highly hydrated polymer layer undergoes a collapse, QCM-D will detect a mass loss as the layer transitions from the highly hydrated state to the collapsed state. The detected mass loss reflects a smaller amount of solvent coupled in the collapsed state compared to the hydrated state. The QCM-D data will also reveal a transition from a soft to a more rigid layer, Fig 2.
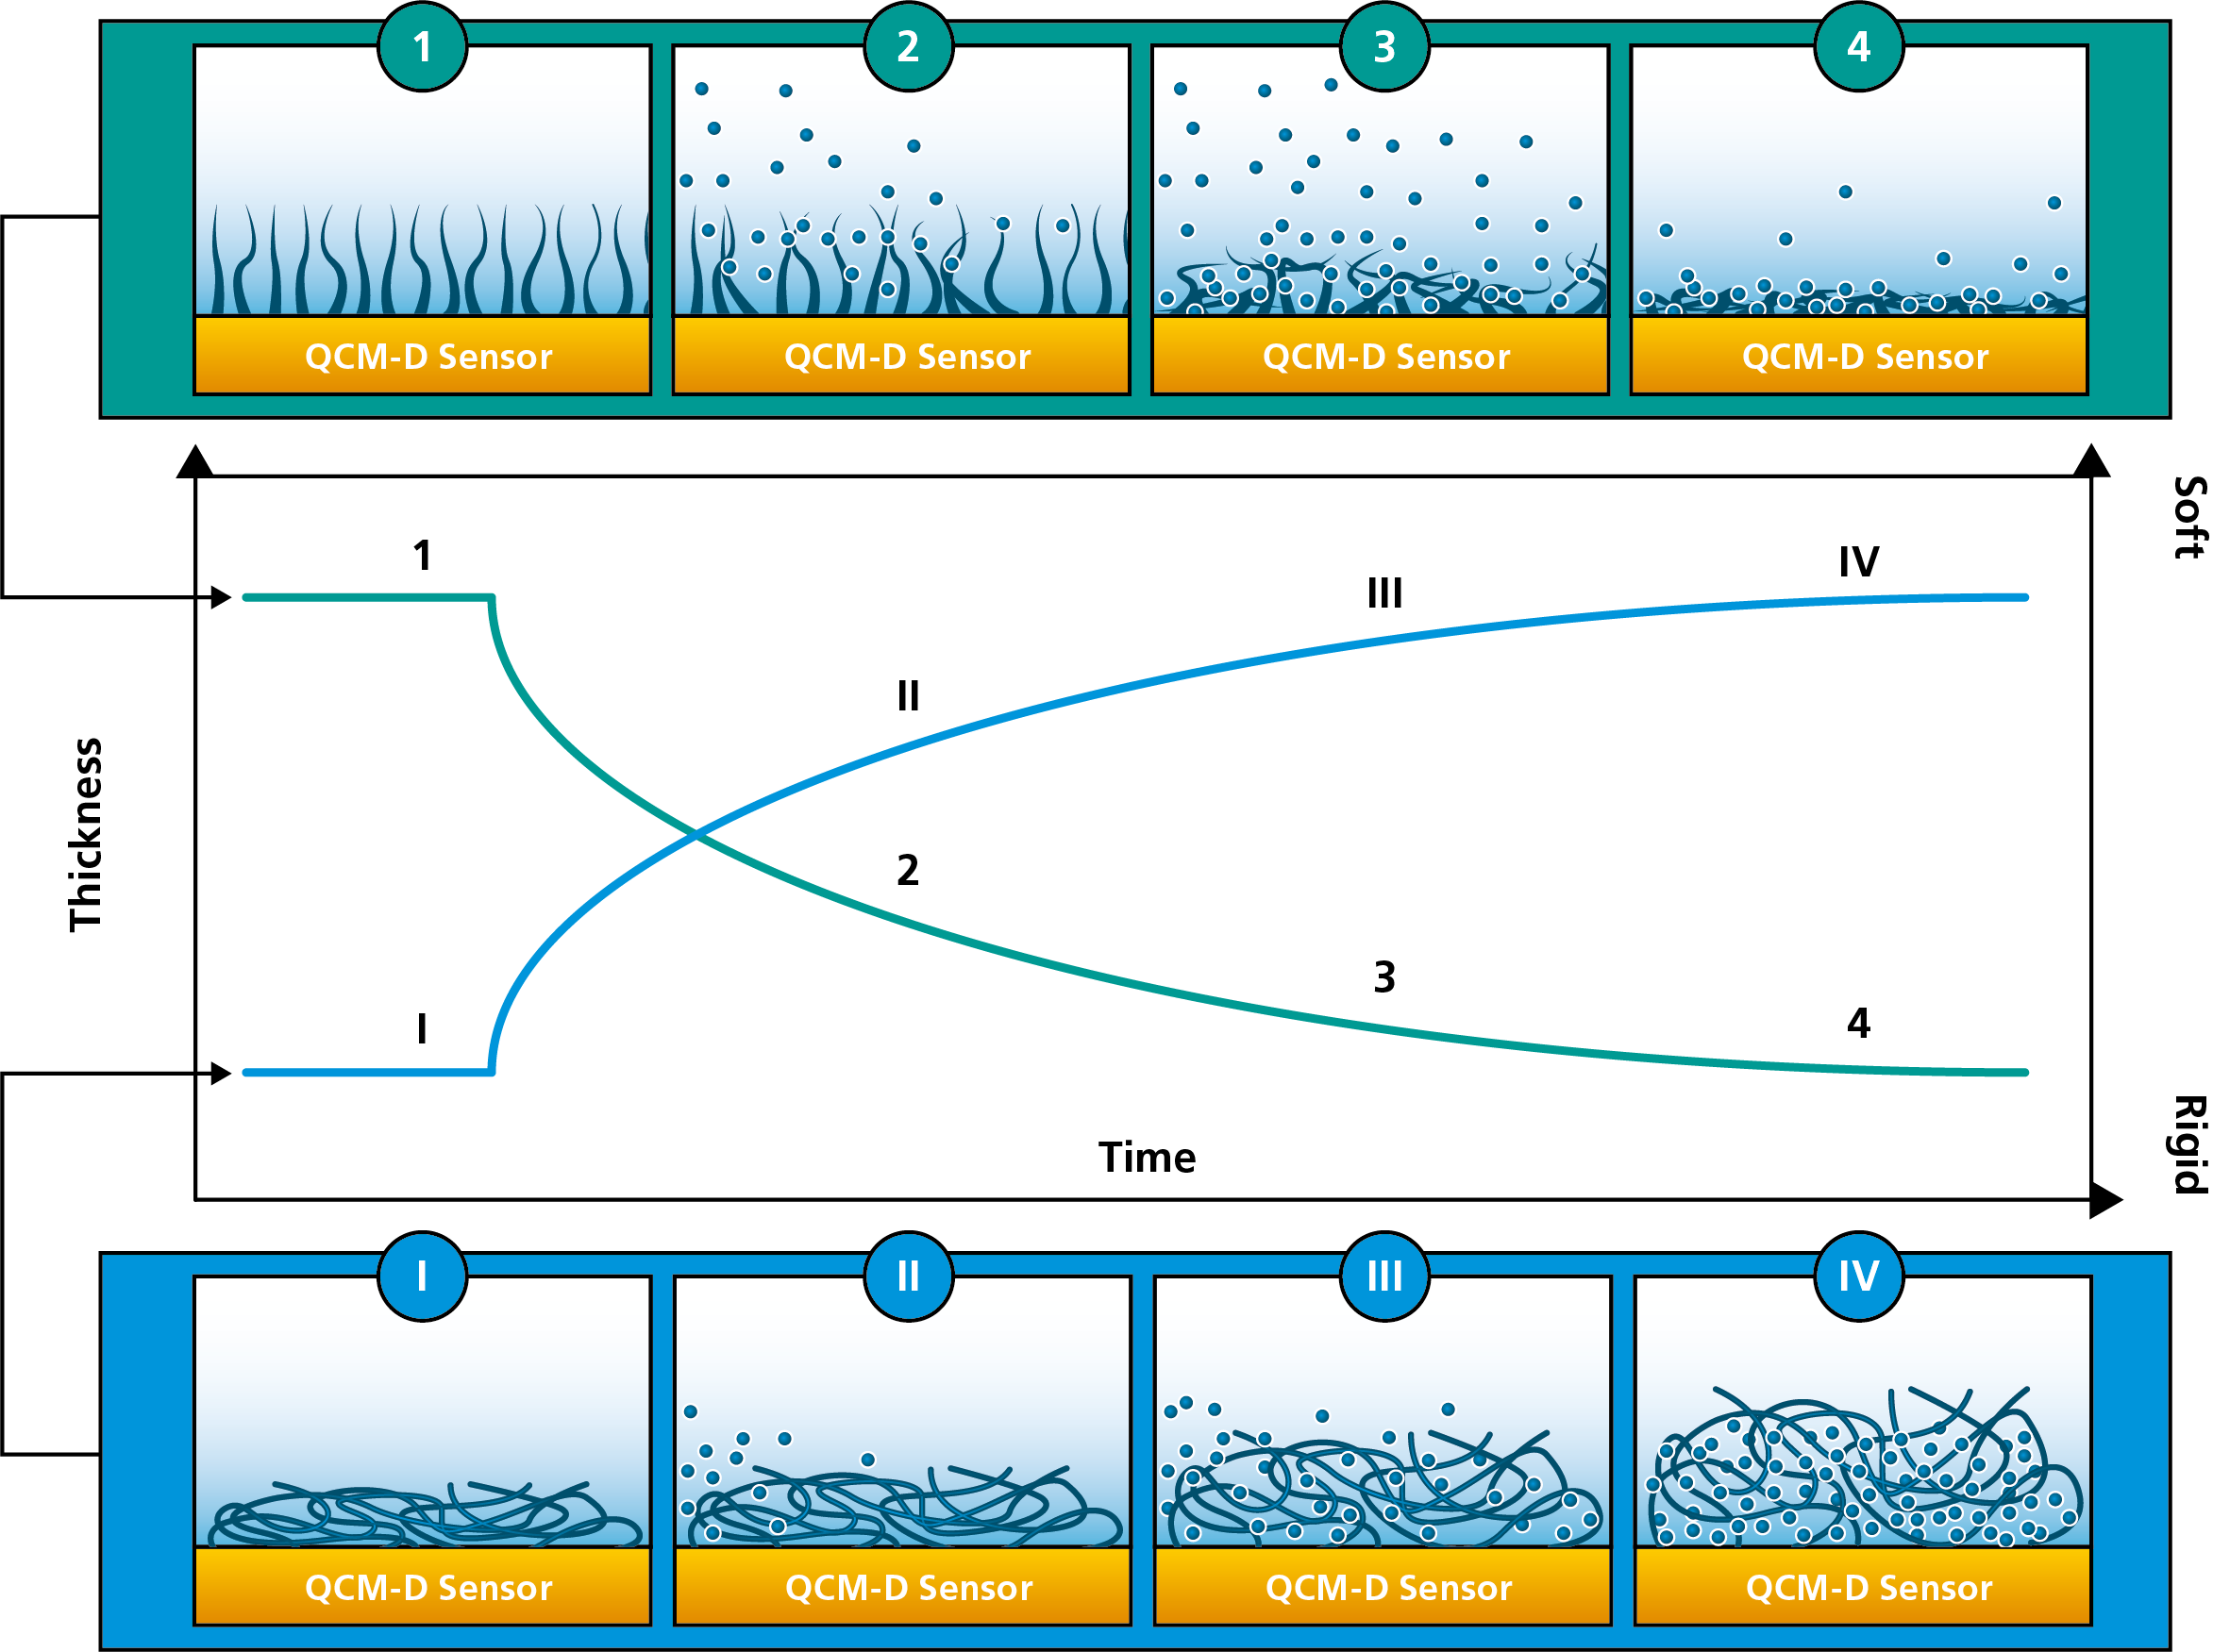
Figure 2. A schematic illustration of structural change as measured with QCM-D. The green illustration (top) shows the collapse of a highly hydrated layer. Initially, the molecules are extending from the surface and couple lots of solvent. The molecules then collapse, release the coupled solvent, and form a thin and rigid layer at the surface. The thickness change is illustrated by the green curve in the graph. The blue illustration (bottom) shows the opposite. Initially there is a thin and rigid layer at the surface, which then swells to become thick and soft. The thickness change is illustrated by the blue curve in the graph.
Download the overview to learn more about QCM-D technology and what information you can extract from QCM-D data.


Malin graduated in engineering physics in 2006, where her research focused on the QCM-D technology. Since then, she has been scrutinizing the how’s and why’s of the world in general, and the world of QCM-D in particular.